%20(250%20x%20100%20px).png)




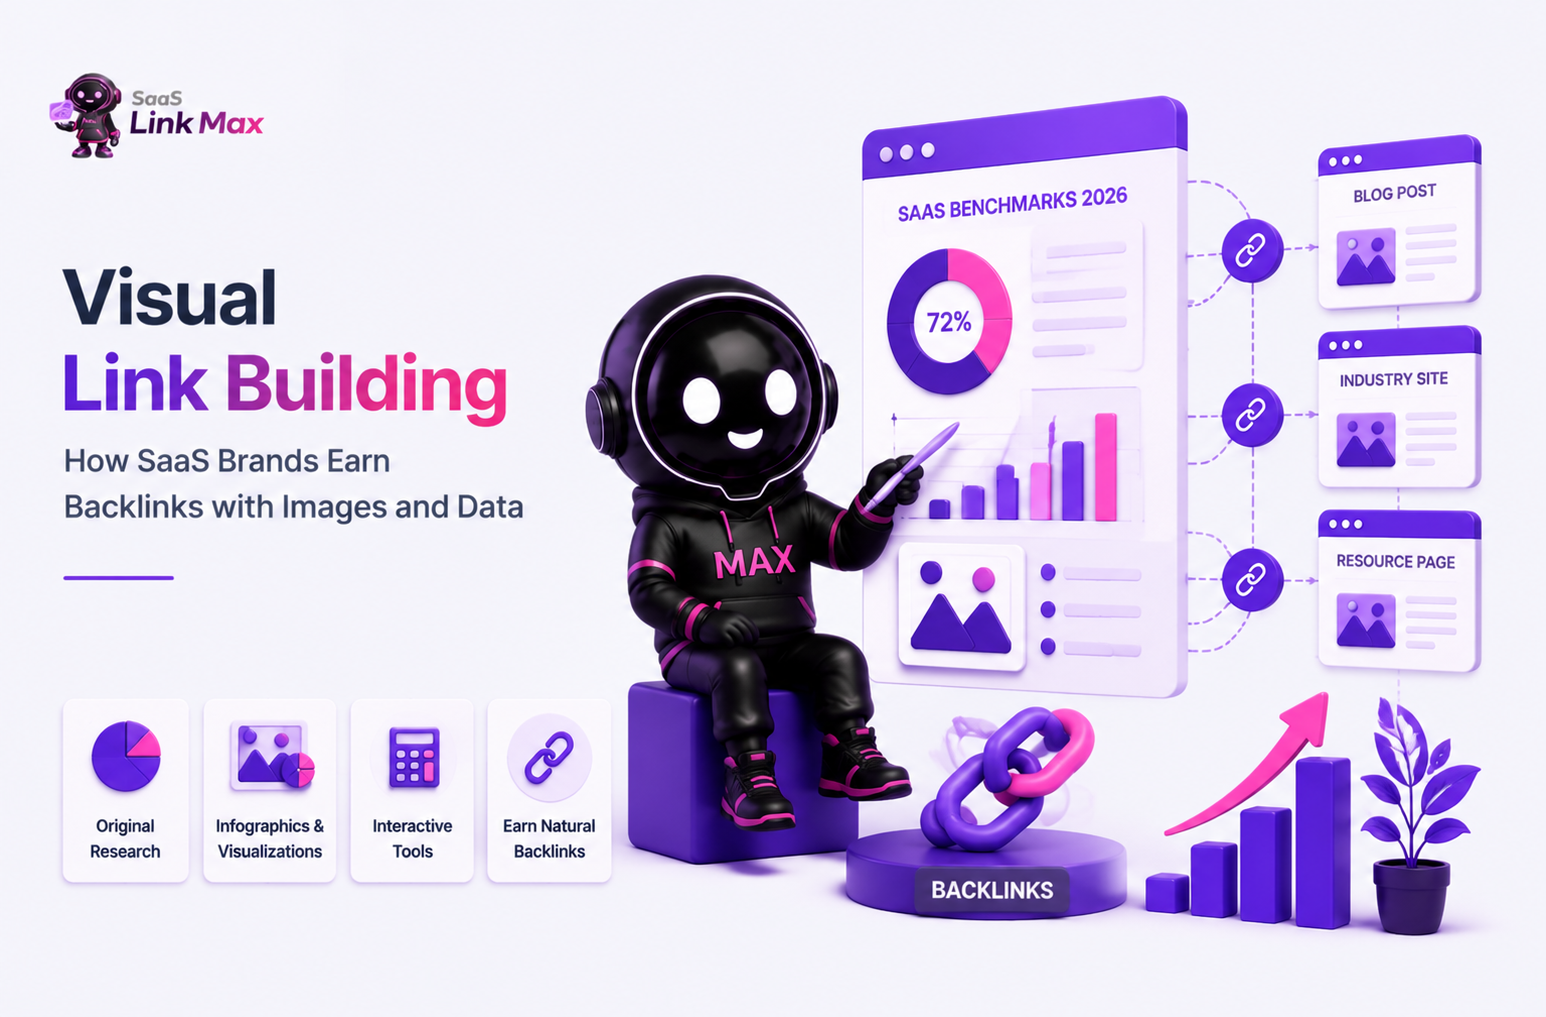
The core idea of visual link building is to give other sites something visual and clear they want to reference, instead of asking them to link to your text. That’s a simple stat they can cite or a chart they can embed.
In this guide, I’ll show exactly how this works for SaaS brands specifically - what to build, how to build it, and how to get it in front of the people who'll link to it. It’s all based on what our SaaS link building company has tested hundreds of times and found effective.
What Is Visual Link Building?
With visual link building, you create original visual assets, like data visualizations, infographics, or interactive tools. You do it because they're more likely to earn citations and embeds than plain text content.
It's different from "image SEO," which is mostly about optimizing images you've already published (alt text, file names, compression). Visual link building starts earlier than that. It's a content strategy decision: you're choosing to build something visual because visual assets get linked to more than paragraphs do.
SaaS companies have a specific advantage here that most other industries don't: product data. You already have usage data, conversion benchmarks, churn patterns, or feature adoption numbers sitting in your analytics. Nobody else has that exact data set. That's the raw material for the single most linkable asset type there is - original research.
Why Visual Assets Earn Links When Text Doesn't
The mechanism is simple: citation dependency. When you publish original data, anyone who wants to reference that specific number has no alternative source. They have to link to you, because you're the only place the number exists.
This is also why visual assets outperform by Google stardards. A chart or infographic that answers a query visually keeps people on the page longer, reduces bounce rate, and gets shared without anyone having to write a full article about it. Text can do this too, but it takes a lot more words to get there.
The Four Types of Linkable Visual Assets
Based on what we've seen work across SaaS link building campaigns, visual assets break down into four categories, each with a different backlink mechanism:
The first three are proactive - you're building something new. The fourth is reactive. You're recovering value from assets you've already published. A mature visual link building program usually runs all four at once, but if you're starting from scratch, original data and interactive tools tend to have the best ROI for SaaS specifically, because they map directly onto the kind of data your product already generates.
It's worth noting these aren't mutually exclusive with other acquisition channels - a strong data asset also makes for excellent digital PR for SaaS pitches, since journalists are actively looking for citable numbers, not just stories.
Finding a Topic Worth Building Around
The biggest mistake we see is starting with the design instead of the research. A beautifully designed infographic on a topic that's already been covered a dozen times will get ignored. The topic has to fill a real gap.
Here's the research sequence we use before building anything:
- Run a keyword and content gap analysis. Use Ahrefs Content Gap or Semrush Keyword Gap against two or three competitors. You're looking for informational keywords where competitors rank with thin, text-only content and no strong visual asset exists yet.
- Check image search saturation. Search your target keyword in Google Images. If the results are all stock photos or recycled charts, that's an open lane.
- Look for data-heavy queries with no visual answer. Searches like "SaaS churn rate by industry" or "email deliverability benchmarks" signal that people want numbers, not opinions - that's a strong sign a statistics page or data visualization will outperform a blog post.
- Mine your own product data first. Before pulling third-party statistics, check what you can pull from your own platform. Usage patterns, feature adoption rates, or benchmark data from your customer base is inherently exclusive - nobody else can publish it, which means nobody else can out-rank you on it.
If you want a faster way to generate topic ideas once the gap analysis is done, a simple prompt works well: ask an AI tool to act as a growth marketer for your niche and generate a list of simple, shareable linkable asset ideas - tools, calculators, or visualizers that bloggers and journalists in your space would naturally reference. It won't replace the research step above, but it's a good way to turn a content gap into ten concrete asset ideas in a few minutes.
For more on how to think about this category of content overall, we've written a deeper breakdown of linkable assets and what separates the ones that earn links from the ones that don't.
How to Build a Visual Link Building Asset?
Original Data and Surveys
If you're running a first-party survey, aim for at least 200-500 respondents and document your methodology clearly - sample size, collection method, and date. This is what makes the data citable. A journalist referencing your number needs to be able to say where it came from.
If you don't have survey capacity, your own platform analytics are just as valid, arguably more so, since they reflect real behavior rather than self-reported answers. Either way, the goal is the same: produce a number nobody else can publish.
Infographics and Data Visualizations
Format matters more than most teams realize. SVG files contain machine-readable text nodes, meaning Google can read the labels and statistics inside the image directly, without relying on vision models. For text-heavy or data-dense infographics, SVG is the safer choice. For photography-based or highly stylized visuals, WebP keeps file sizes down without sacrificing quality - keep it under 200KB to avoid hurting page load speed.
We've used this combination - original data paired with an interactive statistics page - in client work before. In our digital business card SaaS case study, we built out data visualizations as part of a statistics page, using it as a central asset that other sites in the space could reference and embed rather than relying purely on outreach to place links one at a time.
Interactive Tools and Micro-Apps
Some of the most-linked tools on the internet are single-purpose: a color palette generator, a sleep cycle calculator, a simple ROI estimator. The pattern that works is picking one narrow problem your audience has, solving it in a single interaction, and giving the tool a memorable, literal name.
Launch it somewhere with built-in distribution - Product Hunt and Betalist are the two most reliable, since early traction is what gets a tool in front of the bloggers and newsletter writers who'll embed it later.
On-Page Optimization: SEO and AI Overviews
Building the asset is half the work. If the page around it isn't optimized, you're leaving a lot of the value on the table - both for traditional rankings and for AI Overview inclusion, which now pulls from visual content pages more than it used to.
The essentials, in order of impact:
- Keyword-aligned file names and alt text. Alt text should describe what the visual shows and include the primary keyword naturally. Keep it under 125 characters.
- ImageObject schema. This tells search engines the image's name, author, and canonical URL. Without it, Google has to infer everything from context.
- A short HTML transcript below the visual. A 150–200 word plain-text summary of the data points mirrors what's in the image and gives Google (and AI crawlers) clean, parseable text to index. This matters more for infographics than for interactive tools, since chart labels aren't always reliably read by vision models.
- Passage-independent writing. Every paragraph around the asset should stand on its own as a complete, factual statement. This is what makes a page extractable for AI Overviews - vague or context-dependent sentences get skipped.
- An embed code block. If you want other sites to attribute the visual back to you, make it effortless. A pre-written HTML snippet with your canonical link removes the only friction that stops someone from republishing it.
If you're building out a broader GEO strategy beyond this one asset, our guide on GEO for SaaS websites goes deeper into structuring content for AI-driven search overall.
Distribution and Outreach
Reclaim unlinked mentions first. Before you build anything new, run a reverse image search or check Ahrefs/Google Alerts for existing uses of your visuals without attribution. This is the lowest-effort win in the entire process - you're not creating demand; you're just asking for credit that's already earned.
Target relevant sites. A backlink from a mid-authority blog that actually covers your niche is worth more than a generic high-DR placement with no topical relevance. This is the same principle behind contextual backlinks in general.
Personalize the outreach. Reference the specific page you found, state the one data point that's relevant to their existing content, and keep the ask low-friction ("would this be useful to include" rather than "please link to me"). Generic templated pitches get ignored; specific ones get responses.
Use multiple distribution channels, not just outreach. Pinterest, LinkedIn document posts, and relevant subreddits each contribute a different signal - Pinterest for image search visibility, LinkedIn for professional reach, Reddit for high-authority referring domains. None of them replace direct outreach, but together they widen the net.
Don't stop after one email. Most infographic and data-asset backlinks close on the second or third follow-up, not the first pitch. Space follow-ups a few days apart and add a new detail each time rather than just bumping the thread.
If active outreach isn't a capacity you have in-house, this is exactly the kind of work expert agencies do with SaaS guest posting and SaaS niche edits. They can run it in parallel with your visual asset, placing it contextually on relevant sites rather than waiting entirely on passive discovery.
Measuring ROI Correctly
The most common mistake in tracking visual asset performance is measuring too early. Most teams check backlink counts at 30-day intervals and conclude that the asset "didn't work." But passive embed attribution builds over 6 to 12 months.
Calculate cost per backlink using a 12-month window: total production cost (design, research, outreach) divided by total referring domains earned in that period.
A single well-distributed data asset routinely produces a lower cost per backlink than a guest post, because the guest post gets you exactly one link while the asset keeps earning passively long after the campaign ends.
Track two things in parallel:
- referring domain growth in your backlink tool of choice
- engagement metrics (scroll depth, time on page) in analytics
The first tells you the link-building story. The second tells you whether the asset is actually being used, which is usually a leading indicator of whether more links are coming.
If you want help identifying the right asset for your SaaS product and getting it in front of the sites that'll link to it, get in touch with our team - we can walk through what's worked in our past SaaS link-building campaigns and how it'd apply to your niche.